
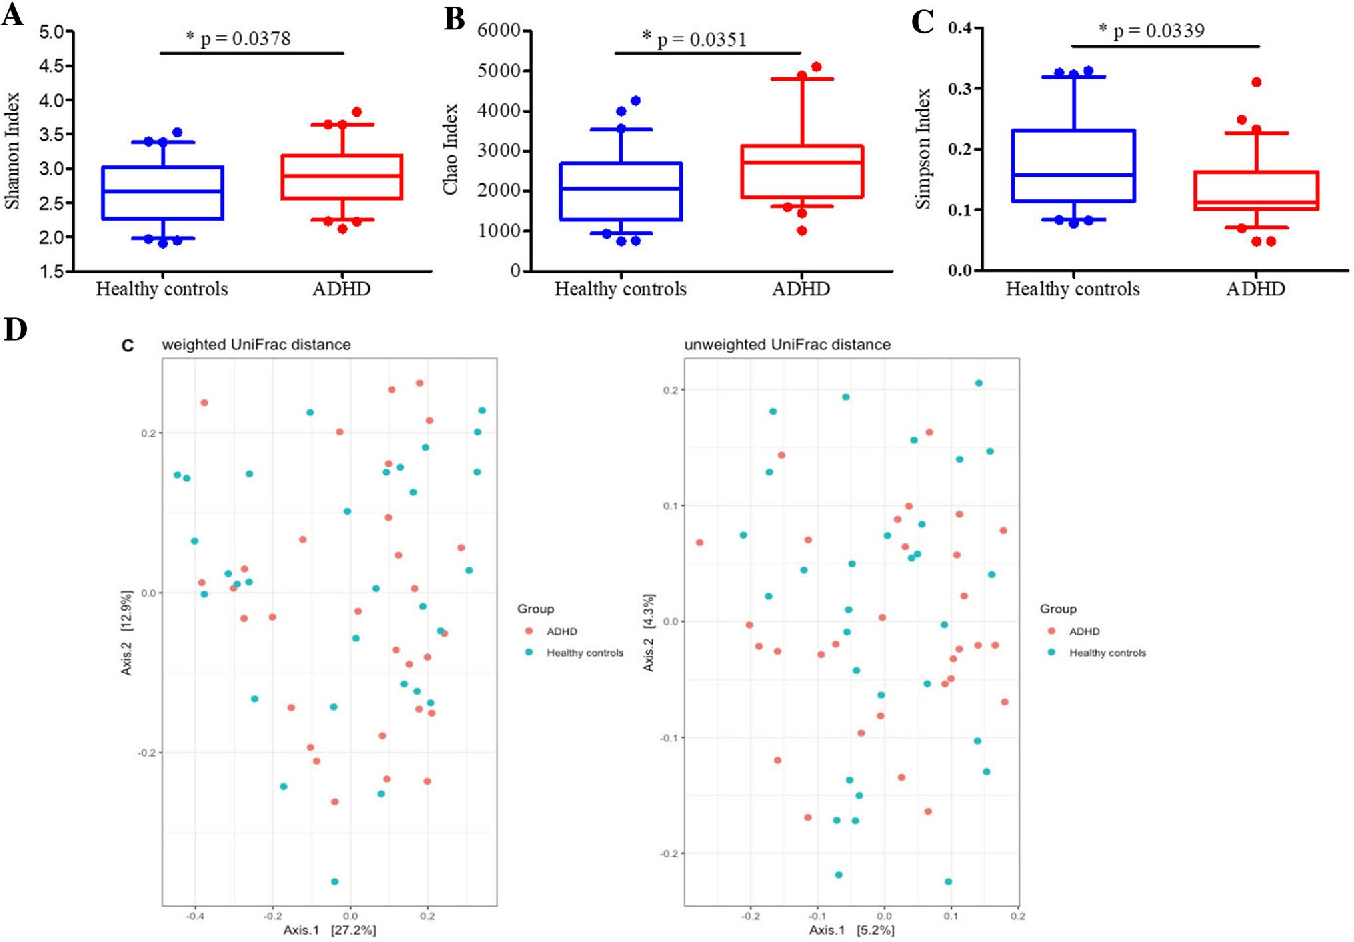
Fig. 1 Comparison of the gut microbiota structures in ADHD patients and healthy controls. The boxplots of Shannon index (a), Chao index (b) and Simpson index (c) were constructed to evaluate microbiome diversity. d PCoA plots were constructed using unweighted unifrac and weighted unifrac analysis
Primary tabs
Fig. 1 Comparison of the gut microbiota structures in ADHD patients and healthy controls
Additional Information
| Field | Value |
|---|---|
| mimetype | image/png |
| filesize | 297.11 KB |
| resource type | file upload |
| timestamp | Oct 26, 2020 |